Three pillars, one number
Fundamentals 45 · Valuation 30 · Moat 25. Code scores the numbers; AI helps grade only the moat.
I build in Stuttgart. A stock-scoring engine and an atlas of European electricity, both live, both built with Claude and reviewed by an expert.
scroll ↓ 01 stockscore · 02 wattlas · 03 how it ships · 04 my storyOne number for the business: 100 points across quality, value and moat. Around it, a score-free read on sentiment, IPOs and events. Each score shows its working: the figures behind every pillar, and how complete the data is.
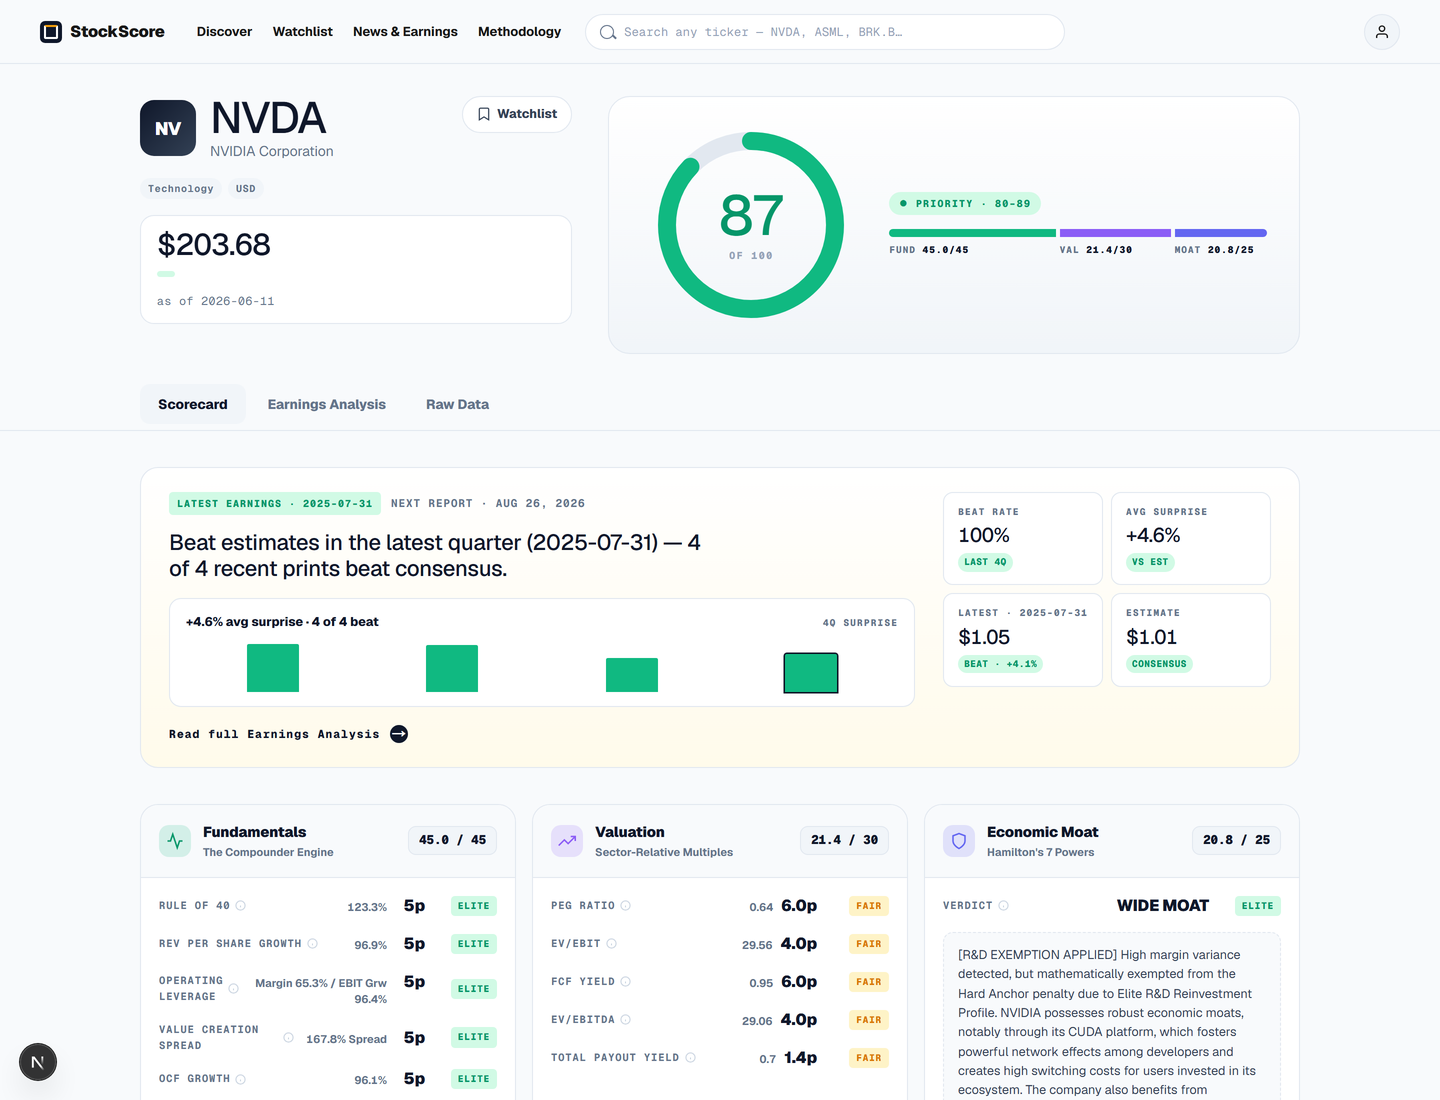
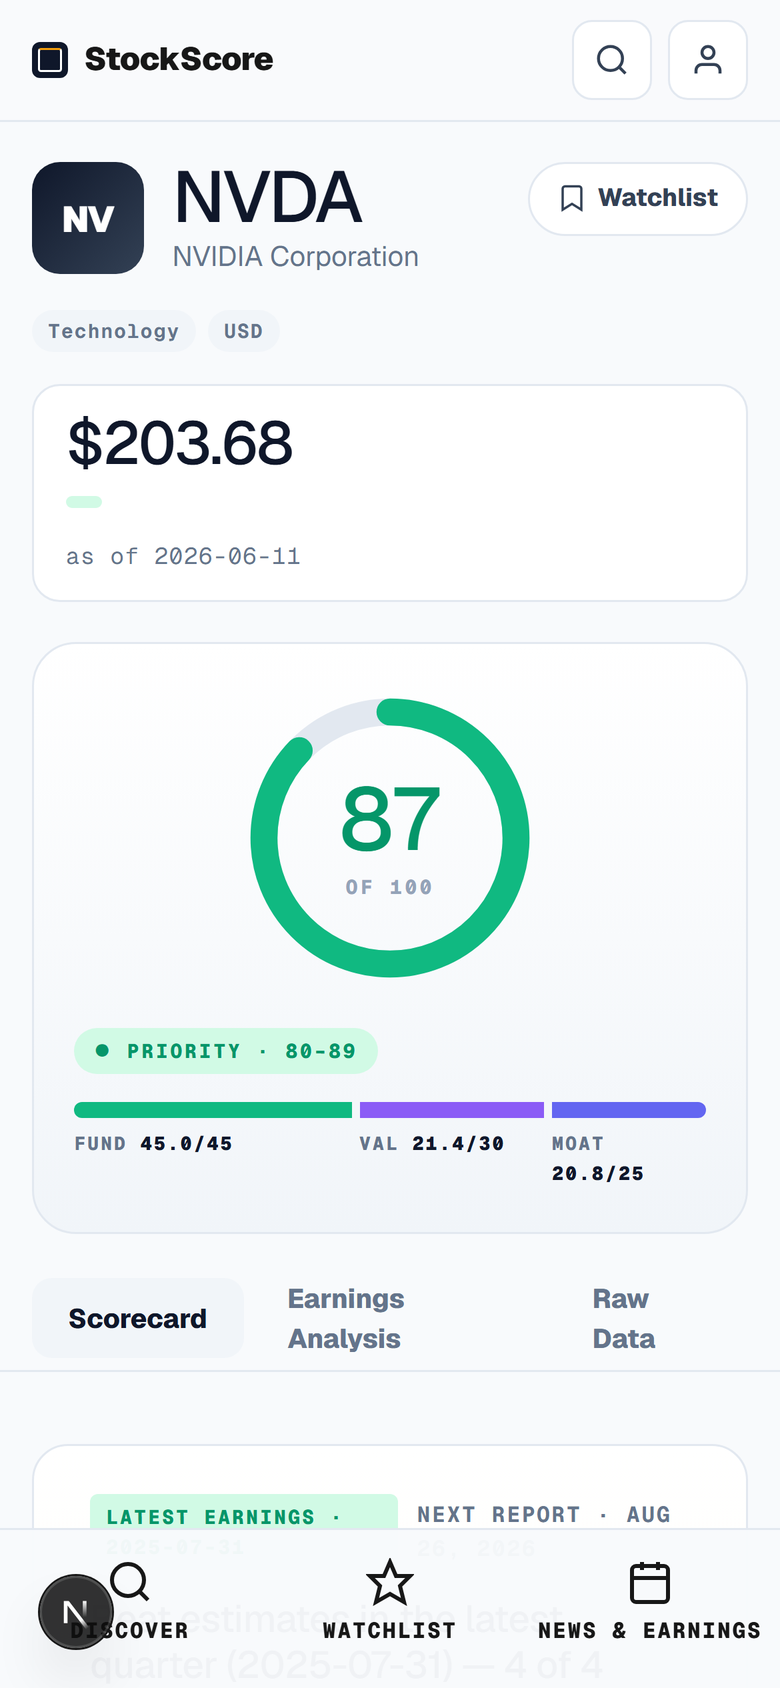
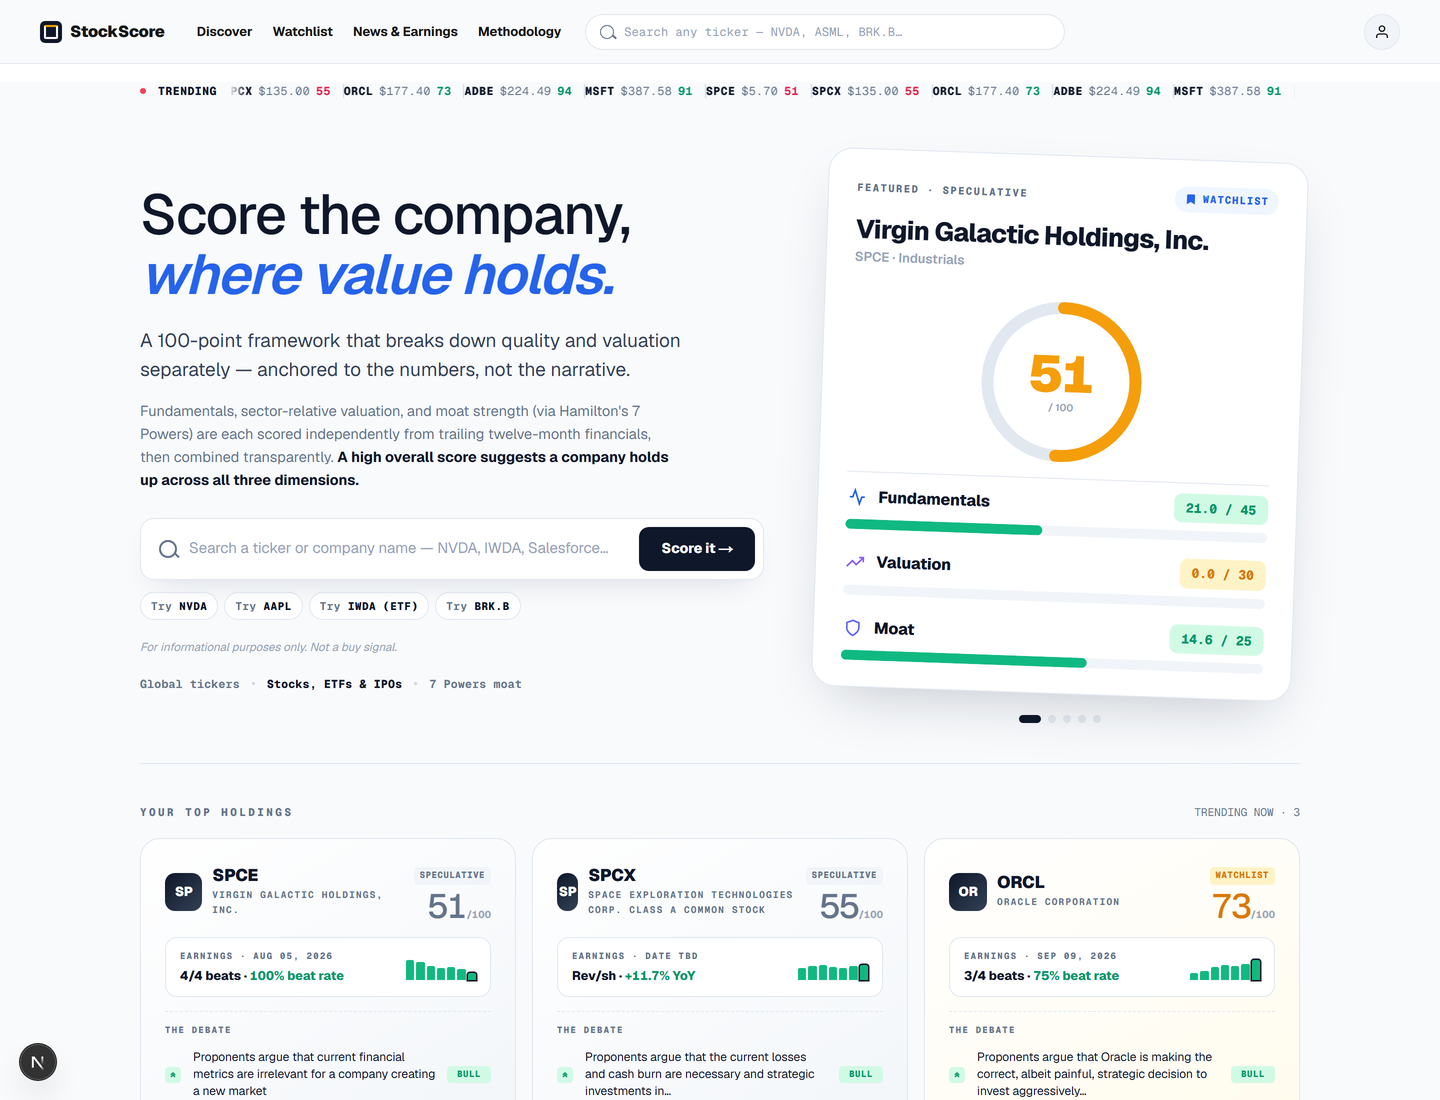
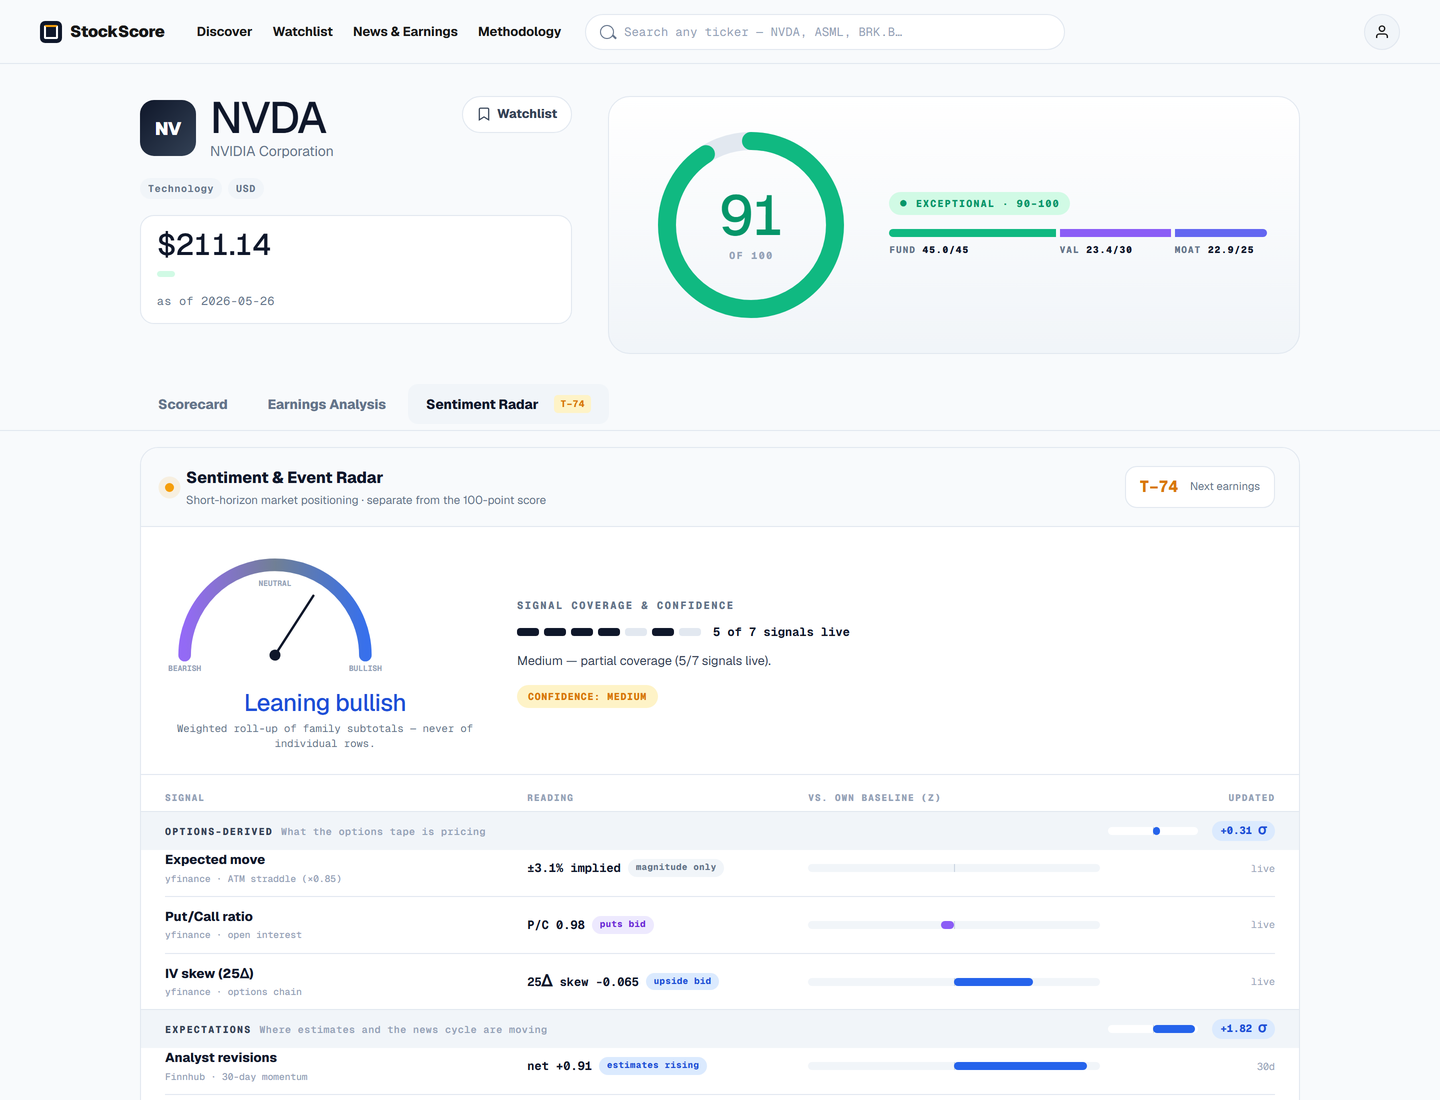
Fundamentals 45 · Valuation 30 · Moat 25. Code scores the numbers; AI helps grade only the moat.
ETFs get their own score, ranked by percentile against funds in the same category.
Sentiment Radar, IPO Radar and Event Briefs carry no score. They show direction on their own blue↔violet axis.
Compare companies side by side, and read an AI breakdown of the latest earnings.
Eight plain questions about European power: when does the price move, what generates it, why do prices split, what happens when supply runs tight, who pays, what plugs into the grid, what AI draws, and what gets built. Thirty-six views answer them, pre-computed from open data on a fixed schedule, with no backend to keep alive.
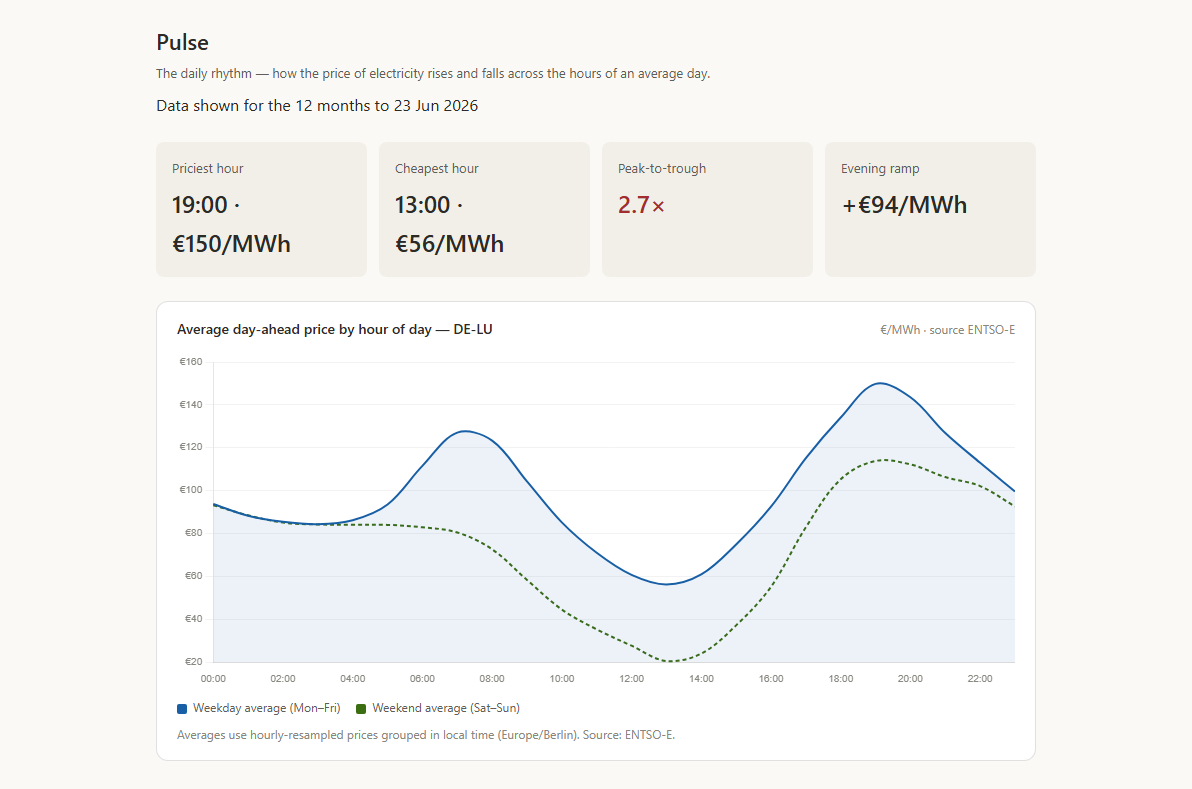
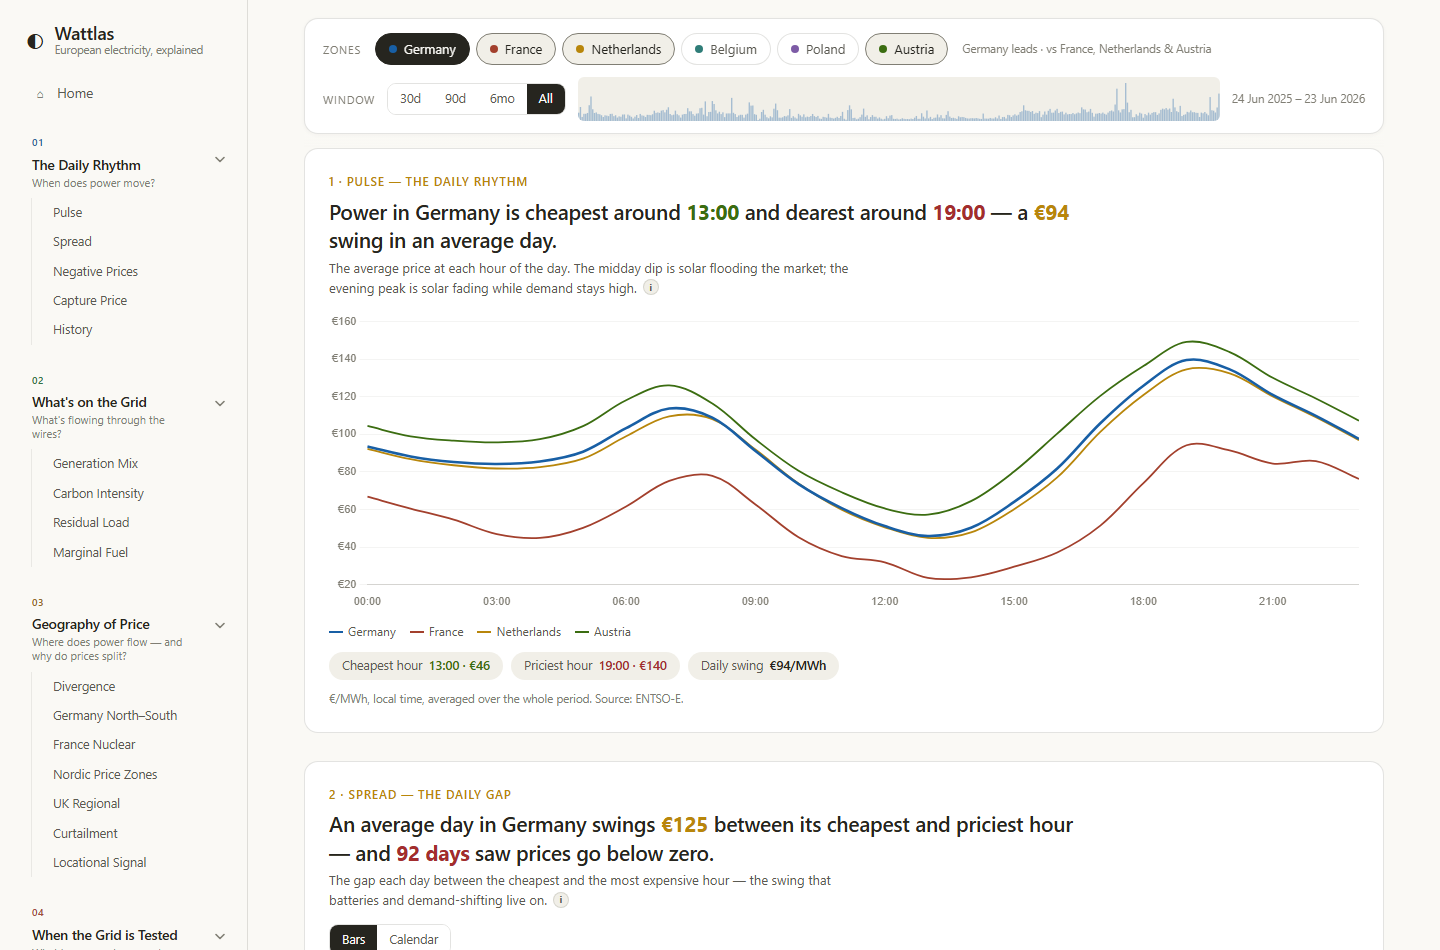
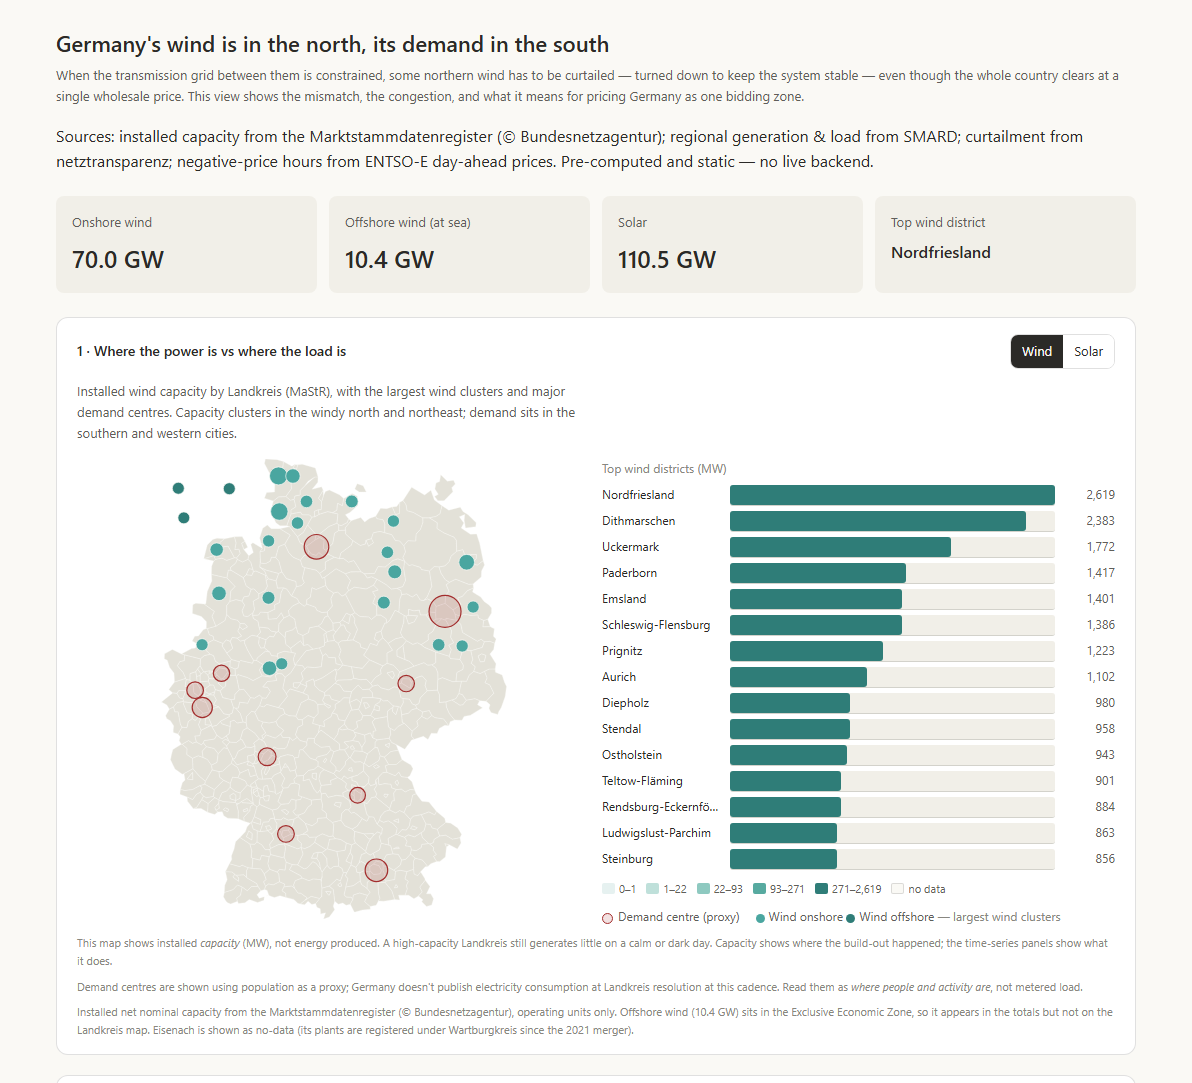
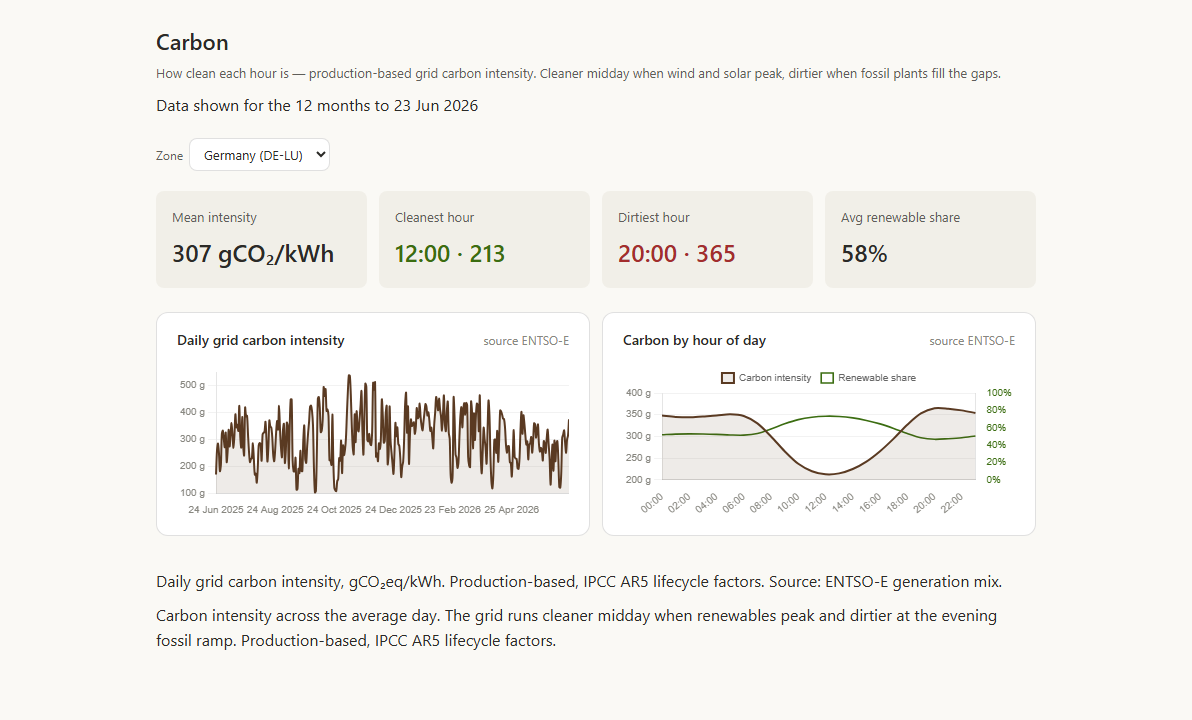
When does power move? The duck curve, the daily spread, negative prices, capture price.
Generation mix, carbon intensity, residual load, and when gas sets the price.
Where power flows and why prices split, in Germany, France, the Nordics and the UK.
Dunkelflaute, storage economics, adequacy, and how far the day-ahead forecasts miss.
What flexibility is worth, and how a megawatt-hour becomes your monthly bill.
Where Europe's cars and first electric trucks plug in, what a charge costs, and how much of the network is built.
Data centres, a flat line for a decade until AI: what they draw, what a token costs in energy, and where that power comes from.
What gets built, and how fast: solar and wind capacity by country and year, and how much of the time it runs.
Both products ship the same way. Claude writes the tickets, the mockups, the code and the tests; a human makes the two decisions that matter, the plan and the release. Work moves in small vertical slices, each one gated, each one readable in a diff.
Behind it, a testing gate on every session: failing-first tests, pre-commit hooks, detect-secrets. Wattlas alone carries 2,921 tests across 117 files: metric functions on inline fixtures, plus the assistant's own suite.
Cloud Run front and back, Cloud SQL behind a VPC, every secret in Secret Manager. The pipeline authenticates with Workload Identity Federation, so no JSON key is stored anywhere. PR checks and a Gemini-call guard sit in front of every deploy.
A scheduled job reruns the Python pipeline on the 1st and 15th at 05:17 UTC, commits only the JSON that changed, and the static site redeploys. Seven open data feeds, each isolated and fail-open, and nothing running between rebuilds.
The two products above are the current chapter. Before them came augmented reality out of a research lab and into car plants, a German company to run, and the work I do now: leading a consulting team at Dassault Systèmes that connects manufacturing planning to what happens on the line.
It is told as six frames on a wall. Each one is faint pencil until you open it, then it inks itself in. The sixth is blank: you write the next one, and it arrives in my inbox with your line already in it.
Weimar, Bordeaux, Tokyo. How should people handle 3D content without a mouse? Five papers and a doctorate later, factories wanted the answer.
Paris. Leading R&D at Diota, turning AR tracking research into something that survives factory light and moving parts.
Stuttgart. Taking over the German company: P&L, hiring, and learning exactly what a business case must look like before anyone signs.
Dassault Systèmes. Leading the DELMIA Augmented Experience consulting team, connecting the digital twin to the people doing the work.
The two products above, designed, built and shipped end to end, with AI doing the typing and a human keeping the gates.
Empty on purpose. Write one line into it and it becomes the start of a conversation.