Wattlas
European electricity, explained.
Open data on how and when the price of power moves across the continent, pre-computed into views built to be read and rebuilt on the 1st and 15th of each month.
Eight questions about power
An editorial landing routes you into one of eight plain-language questions; each opens the views that answer it. Every view compares up to six bidding zones at once.
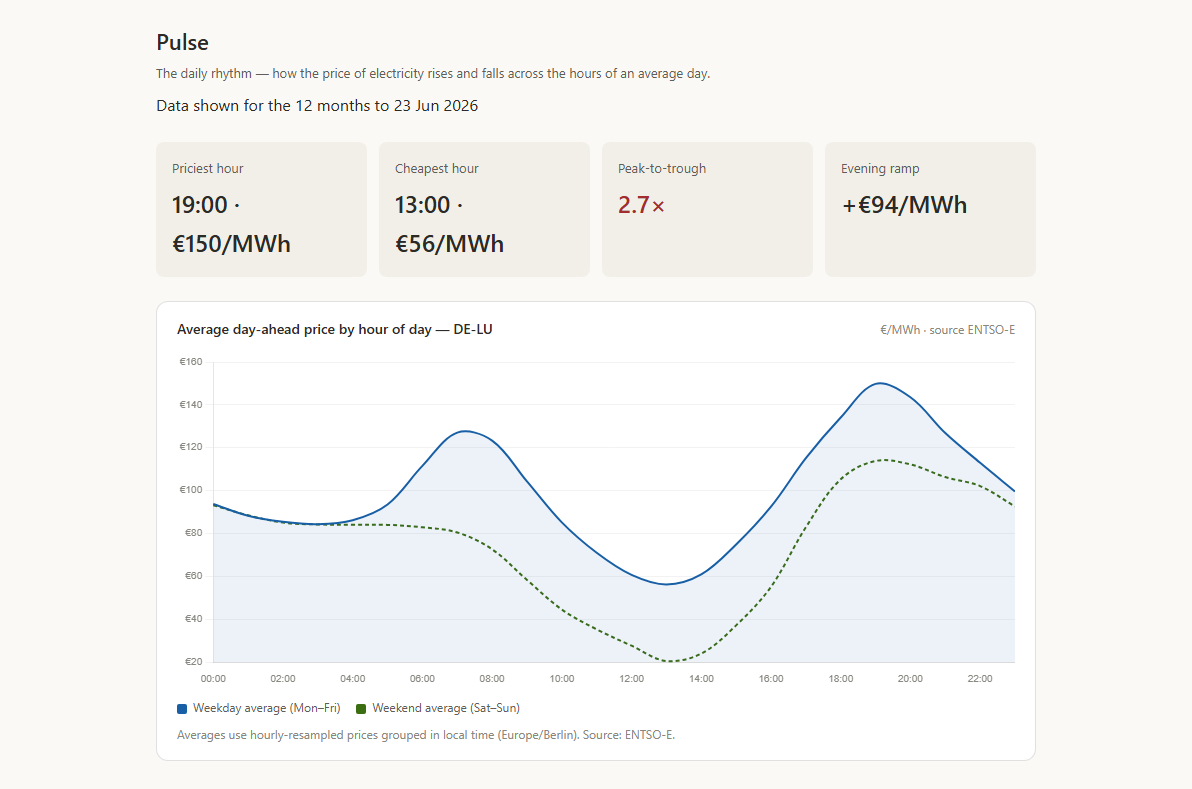
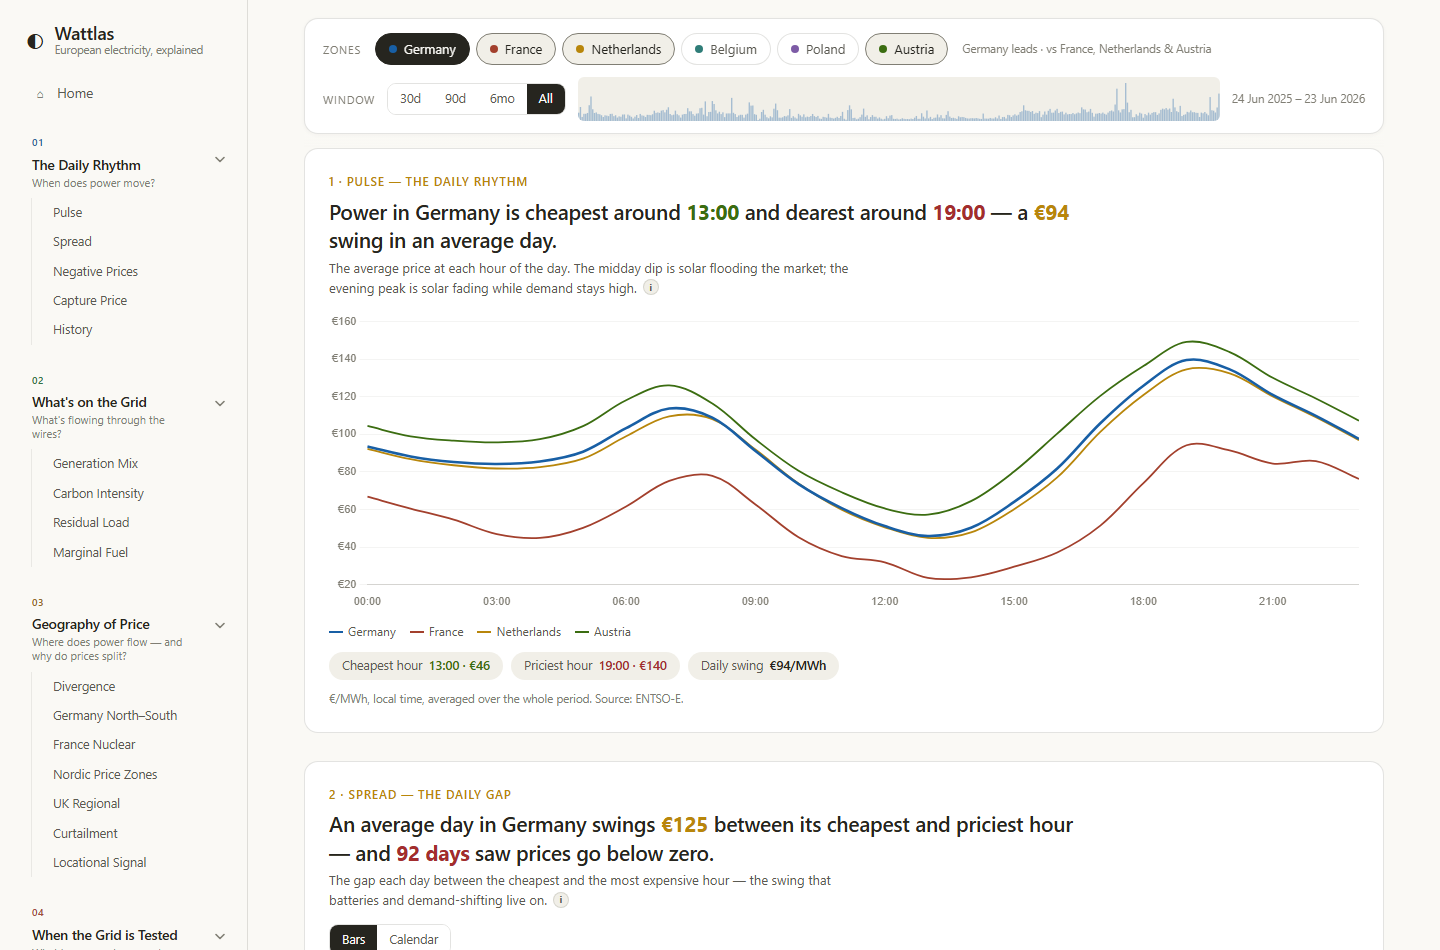
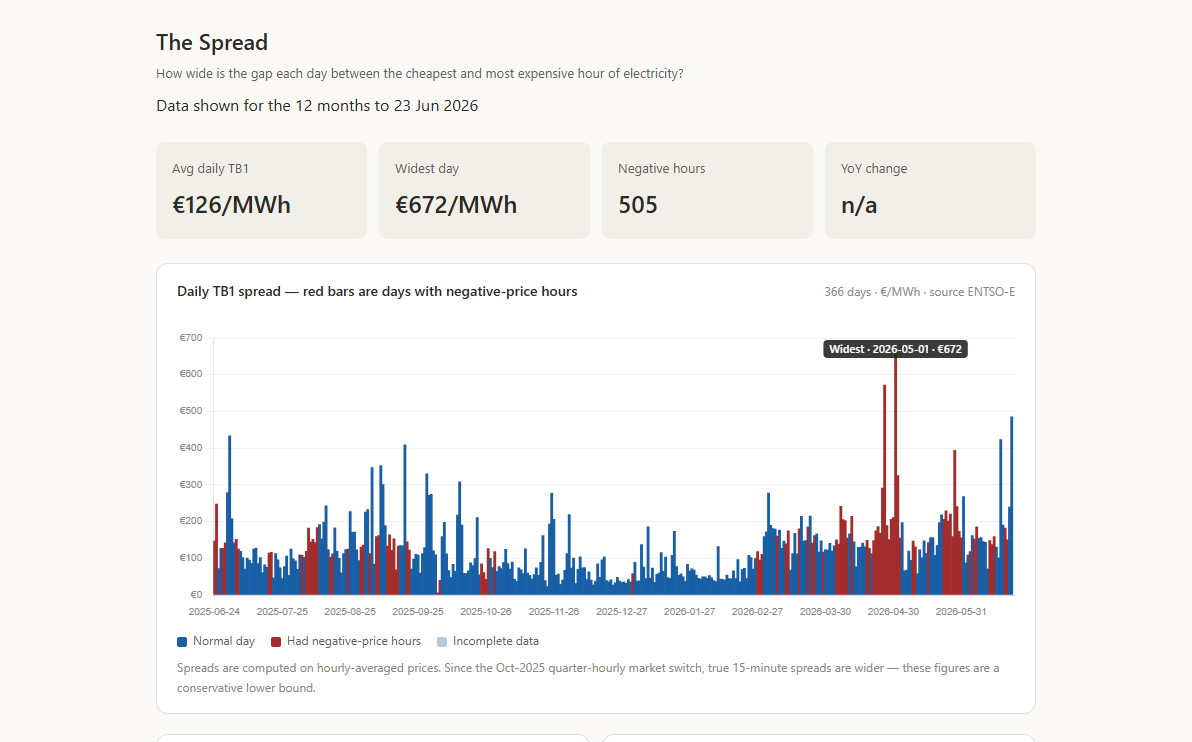
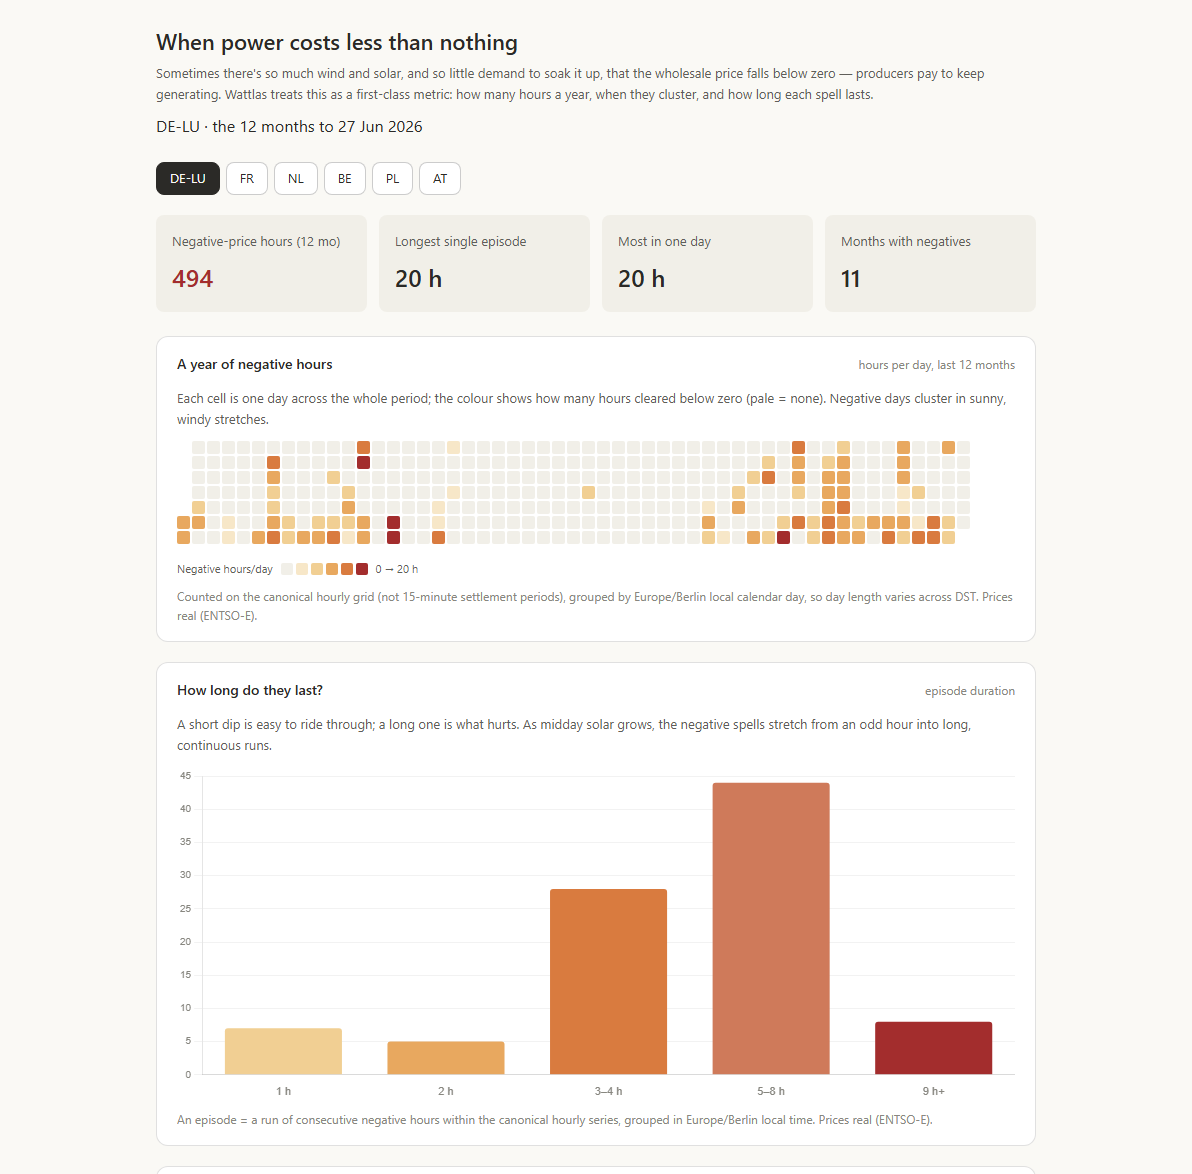
German solar earns ~0.56× the average price: worth least exactly when there's most of it.
Three years of daily spread, free to roam: zoom a week or fold it onto a season.
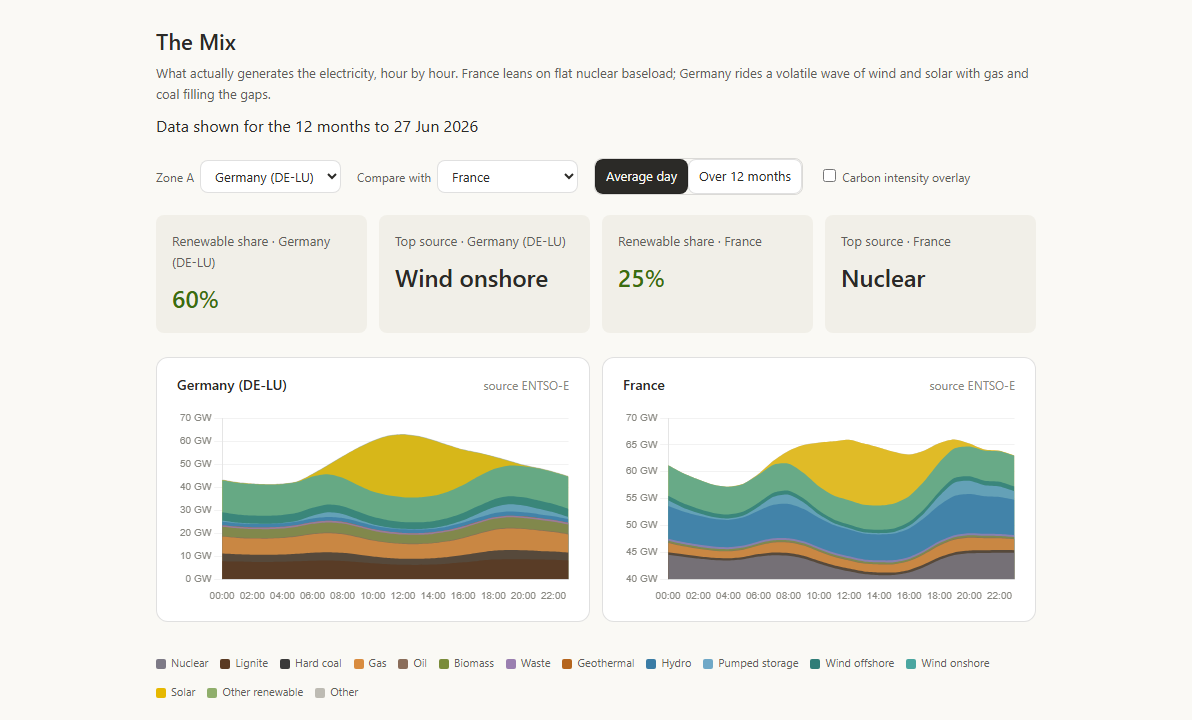
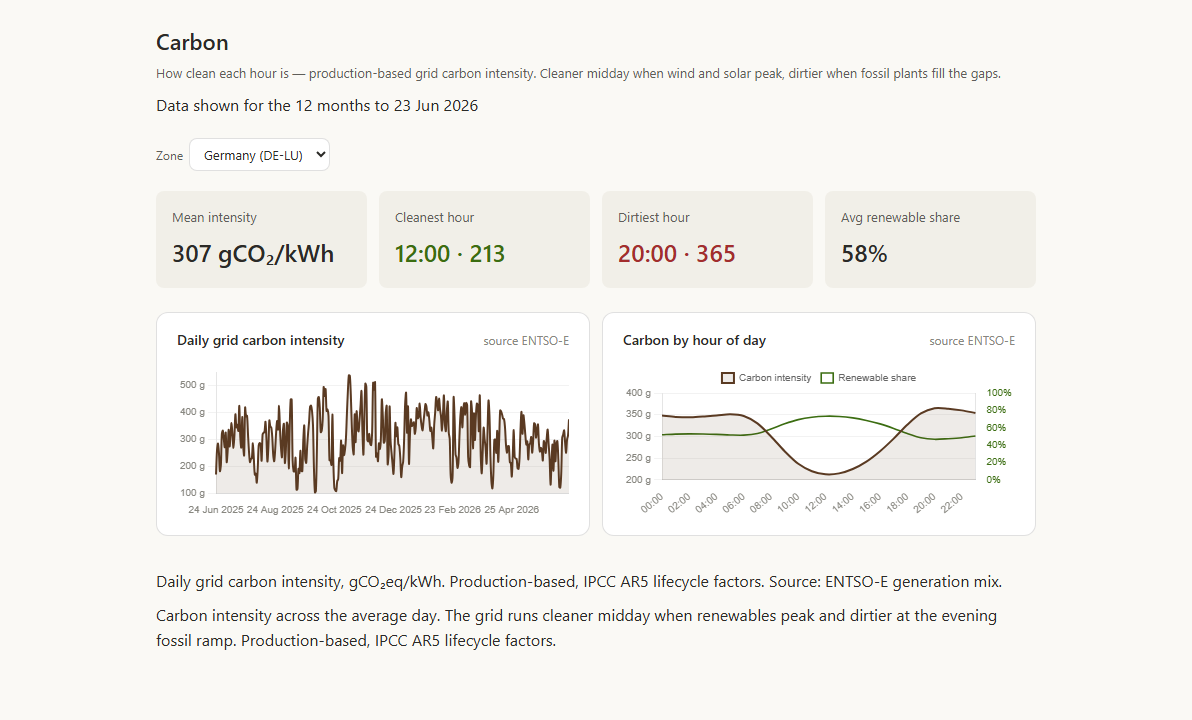
Demand minus wind and solar: the evening gap that dispatchable plant and batteries must still cover.
A model, flagged as one: gas sets the price on roughly 66% of days.
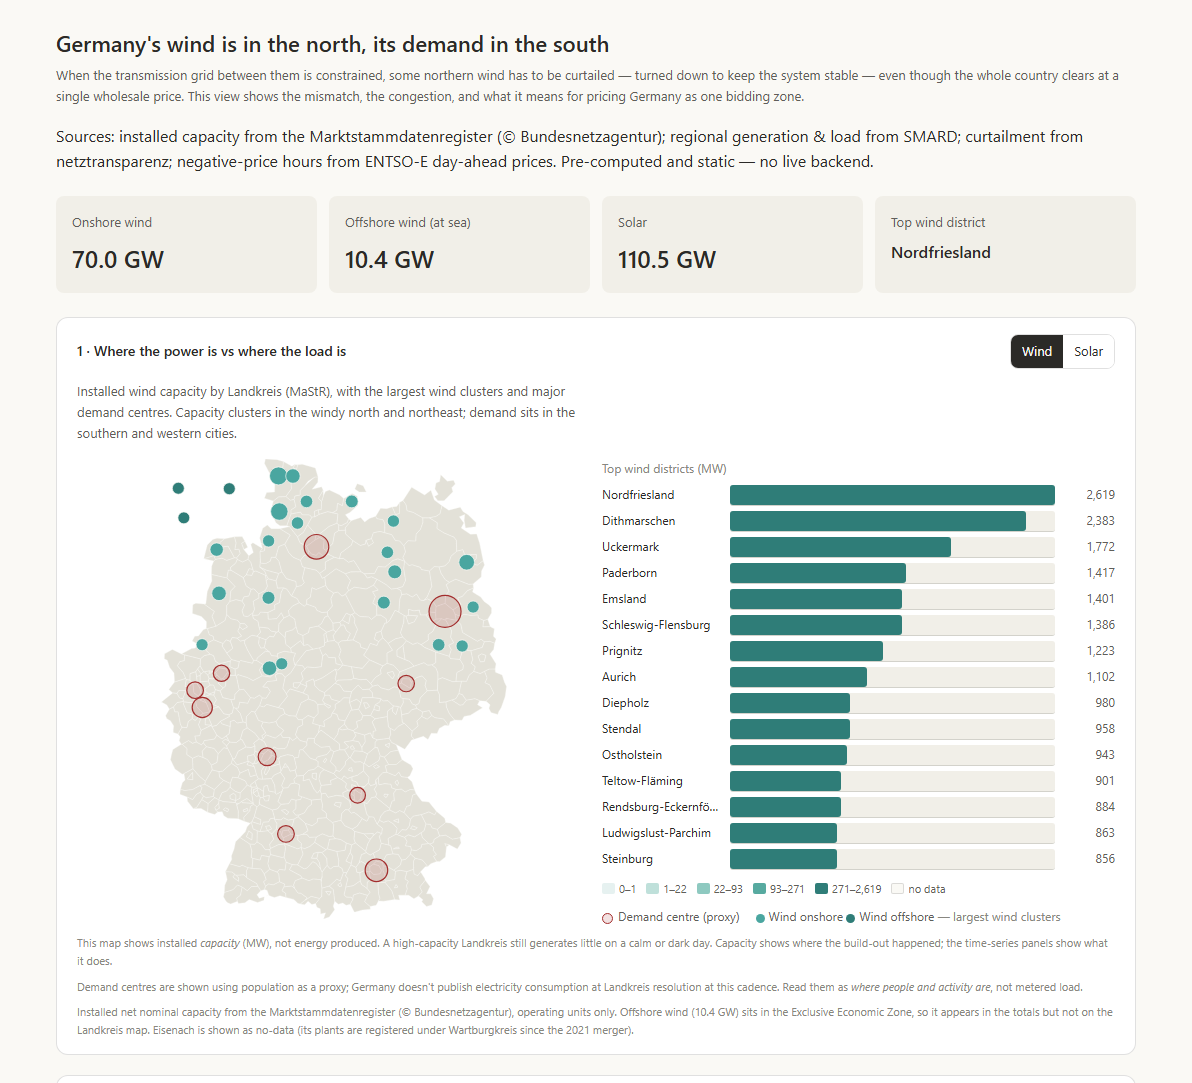
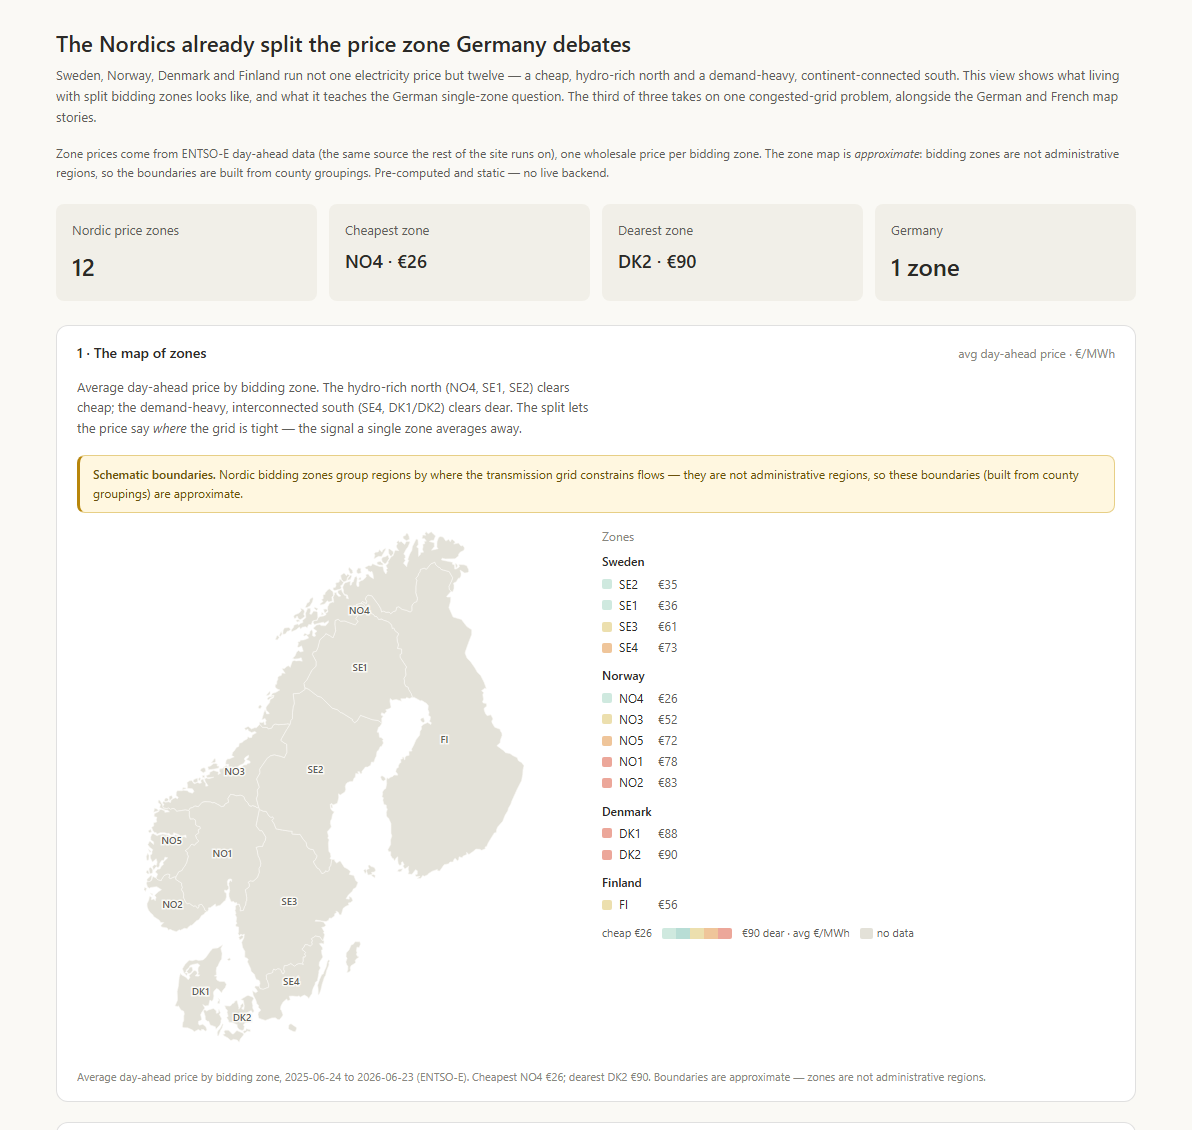
The centralised mirror: ~63 GW, 57 reactors, who exports and who imports.
Britain keeps one price and pays Scottish wind ~£2 bn a year to switch off.
Price gaps between neighbours, the flows that explain them, and the clean power the grid throws away.
When the Grid is Tested
What happens when supply runs tight?
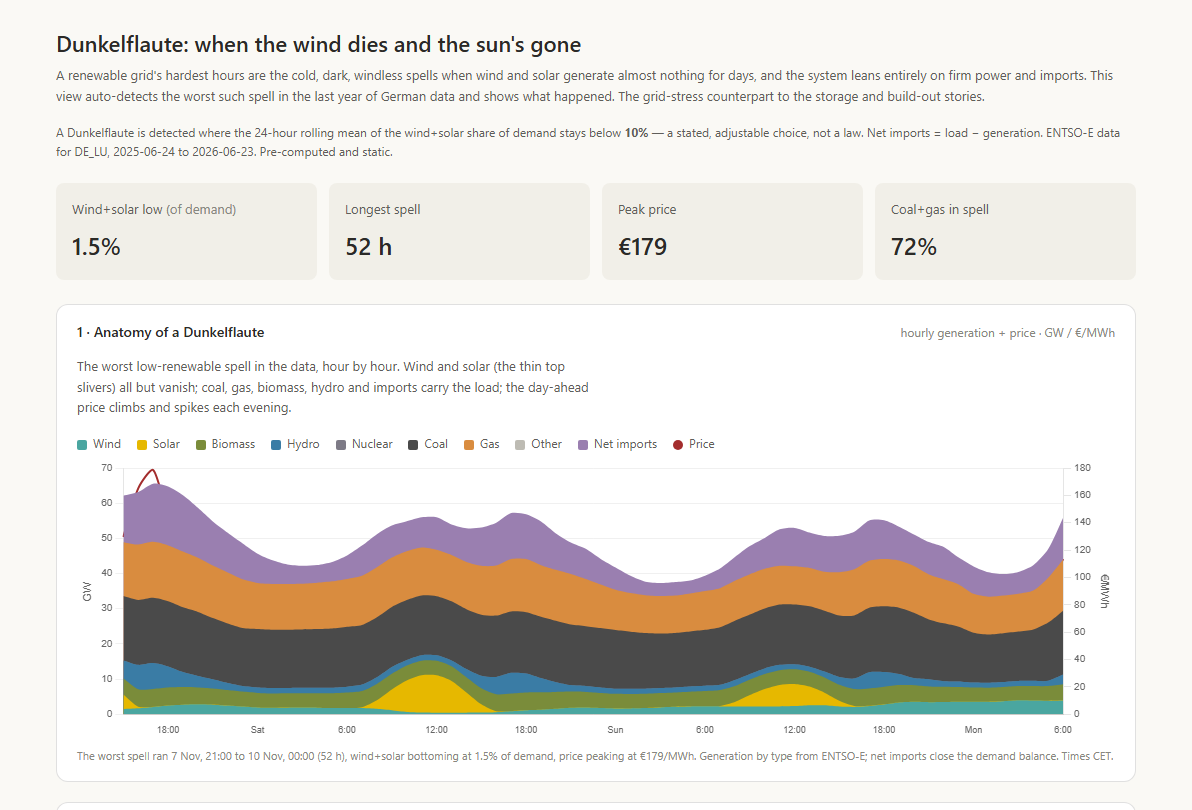
Plus the batteries that live off the daily spread (~6× grid storage since 2021), the adequacy question behind Germany's capacity law (11 GW of auctions, enacted July 2026), and how far the day-ahead wind and solar forecasts miss, control area by control area.
The Bill
What does it cost, and who pays?
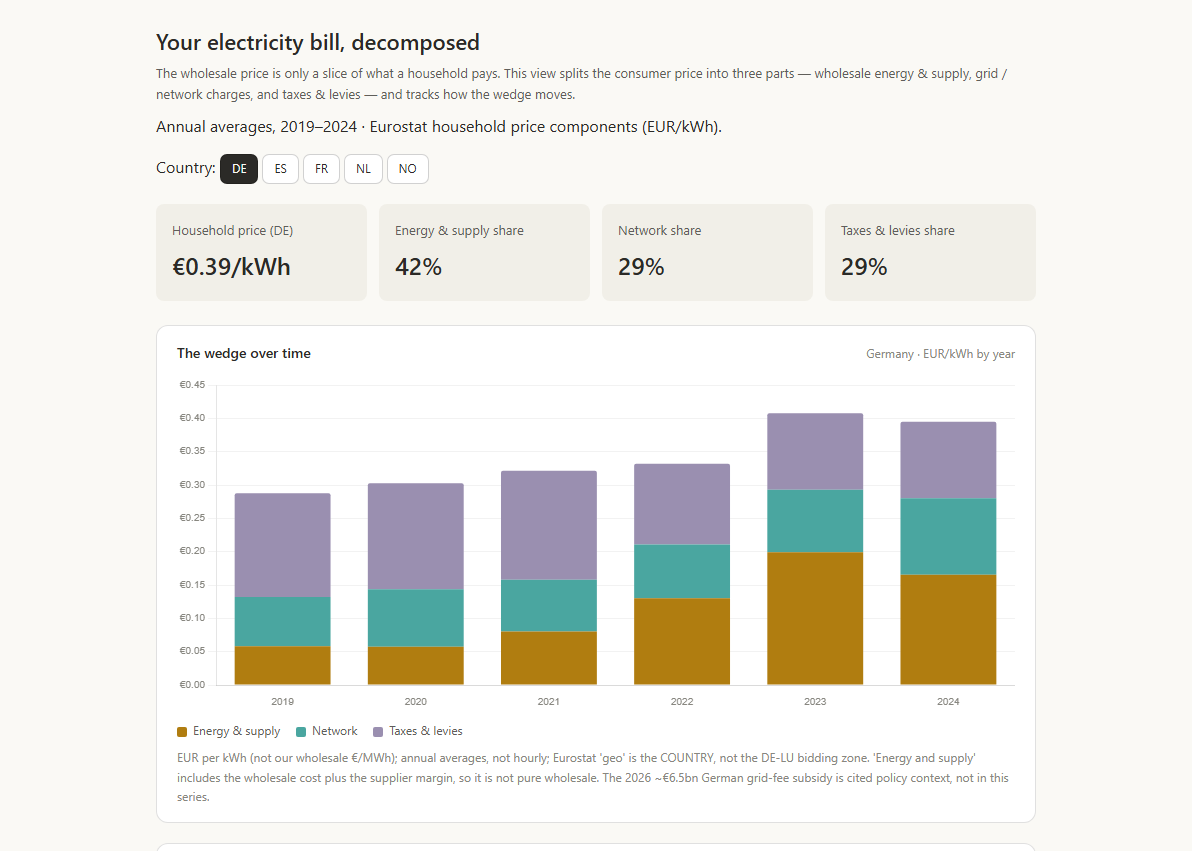
What a shiftable load (an EV, a heat pump, a battery) saves in the cheapest hours, labelled an upper bound. Industrial prices, bounded to country level. And the € price tag on curtailed wind, labelled an estimate.
The Charge
What's plugging into the grid?
Millions of cars and the first electric trucks are a new load on the grid, and the first big one that can choose when it draws. The views cover the vehicles on the road and the rules ahead, the charging network country by country with its heavy-duty corridors, what a charge costs, and what charging draws from the grid.
The Load
What does AI draw from the grid?
Data centres were a flat line on the grid for a decade, until AI. The views trace twenty years of data centres, where the load sits, the cost of a token, what the disclosed token streams would draw, and where that electricity comes from.
The Build-out
What gets built, and how fast?
Solar became the world's largest source of new capacity in the 2020s: 2,391 GW stood at the end of 2025, eleven times the fleet of 2015. Two views: renewable capacity by country and year, and how much of the time it runs.
Eleven open feeds, kept honest
ENTSO-E, NESO, MaStR, SMARD, ODRÉ/RTE, netztransparenz, Eurostat, the KBA, the Bundesnetzagentur's charge-point register, Ember and IRENA, each with its own auth, units, lag and cadence, reconciled to one canonical shape. The pipeline is the only code that touches the APIs; it writes small JSON the frontend reads directly. A scheduled job reruns it on the 1st and 15th at 05:17 UTC, and nothing runs in between.
Each source is its own module; one failure can't break the others.
A missing key writes status:"unavailable" and the view shows "awaiting source" instead of a zero that would look like data.
The Oct-2025 resolution break, 23/25-hour DST days, zones that aren't regions: coded around, in writing.
2,921 tests across 117 files: metric functions on inline fixtures, plus the assistant's own suite.